
Seed Grant Summer 2022 Report
Catherine Ryu and Olivia Hale
Project Description
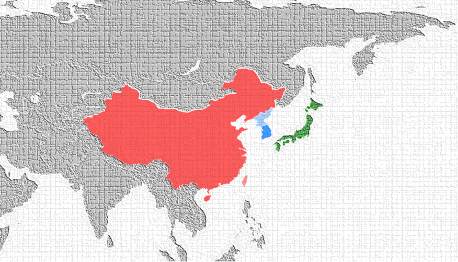
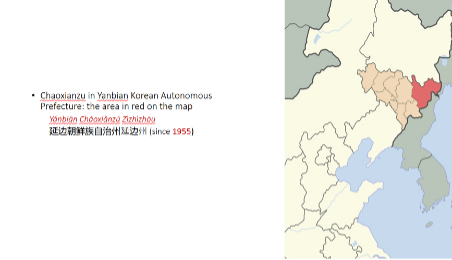
Our project’s main goal in the summer of 2022 was to pilot a viable digital humanities approach to visualizing the movements through time and space in the writings by ethnic Koreans in China (Map 1-a). This diasporic community is situated in the area known as Yanbian Korean Autonomous Prefecture (Map 1-b), which was established in 1955. Among 55 officially recognized ethnic minorities in China, Koreans are known as “a model ethnic minority.” Key distinguishing aspects of this community include their robust cultural activities and high-level education. Their literary works written in Korean, however, are not well known outside China, especially in Western scholarship.
Our project centers on a collection of short stories published in 1989 by Japanese scholar Ōmura Masuo, arguably the first publication of its kind outside China. Comprised of thirteen novellas published between 1955 and 1986, Ōmura’s publication captures three decades of ethnic Koreans’ writings. This collection, currently being translated into English by a team led by Catherine Ryu, represents a slice of this underrepresented community’s collective literary imagination and memory via the fictional characters’ movements through space and time. Guided by the two research questions below, we strove to reflect the multifaceted aspects of our three chosen stories and their interconnectedness within the collection:
Research Question I: To what extent is it possible to translate time and space-related aspects of a literary text into data that can be visualized by digital humanities tools?
Research Question 2: To what extent is it possible to interpret the visualized data to elucidate key defining attributes of literary texts specific to ethnic Koreans’ writings and more broadly to other literary narratives?
To answer these questions, we attempted to pave a conceptual path toward integrating close reading literary practice and quantitative investigation into an innovative method of engaging with literary texts using available digital humanities tools.
Project Outcomes: An Overview
The outcomes of this project pertain to the conceptual, technical, and visual dimensions of our endeavors as a whole:
- a conceptual template for translating literary texts into computational datapoints
- a dataset collected from three novellas
- a set of visualized data using Palladio, Cytoscape, and ArcGIS
- a prototype project website built on Wix
- an enhanced plan for our full-scale project
In this report, we share key aspects of the project’s outcomes, with which we started to formulate answers to our research questions.
The Conceptual: The Meta Structure of Time and Space
Literary writings are unique as a dataset for digital humanities projects as they contain both quantitative and qualitative dimensions, including contingency and indeterminacy. Visualizing the spatiotemporal movements embedded within the novellas selected for this pilot project is of utmost importance since the origin of ethnic Koreans in China lies in their displacements, territorial and otherwise, not to mention the centrality of the fictional characters’ movements through time and space depicted in these literary narratives.
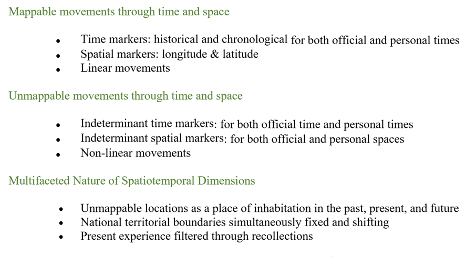
That is why we first attempted to define a meta structure of time and space (i.e., the conceptual structure and logic for identifying and organizing time and space-related aspects of literary texts). When constructing this meta structure, both the tangible and intangible aspects of literary texts were considered (Table 1).
The Technical: Coding the Unmappable Space and the Unchartable Time
To operationalize our conceptual metadata structure of time and space, we used events as a basic unit for delineating the fictional characters’ movements, both physical and mental, through time and space. We defined an event as a single occurrence that contains key attributes such as who, when, where, what, and so on.
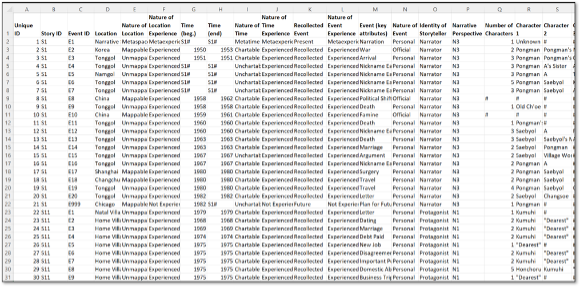
The data collection process involved three steps: (1) close readings of each story in its English translation; (2) color coding any spatial or temporal markers in relation to events in each story; and (3) translating and organizing the color-coded information into datapoints using Excel. The data collection contains two sets of data: one for the individual stories and the other for all stories taken together. Table 2 shows the size of datapoints for each story and that of the aggregate datapoints.
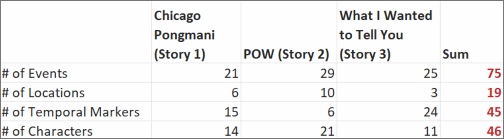
Table 3 demonstrates the breakdown of the meta structure of time and space. Each event was given, for example, a unique identifier and further defined through attributes such as start and end date; key actors’ identifying attributes such as profession, age, marital status, etc.; the nature of the event (i.e., experienced or imagined; official or personal; recollected or reported). Space and time were similarly calibrated based on the nature of the locations (mappable or not; experienced or imagined) and the nature of times (i.e., chartable or unchartable on a timeline; experienced or imagined).
The Visual: Complex Networks of the Mappable and Unmappable Dimensions
To identify patterns of clusters in our data, we used Palladio (https://hdlab.stanford.edu/palladio/), an open source visualization platform. Since Palladio can visualize only two dimensions of the data at a time, to demonstrate the fictional characters’ movements, we created a series of linkage from the primary and secondary attributes of event, time, and space as will be shown in the remainder of this report.
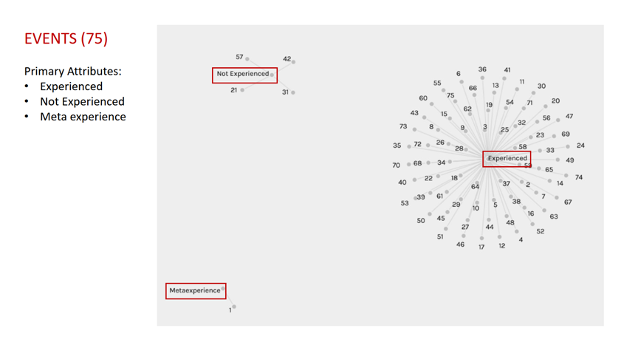
Figure 1, for example, illustrates the relationship between events (numbers) and the nature of the events (nodes). The predominance of experienced events reflects how the stories are largely driven by the fictional characters’ personal experiences.
The experienced events can be further differentiated as shown in Figure 2.
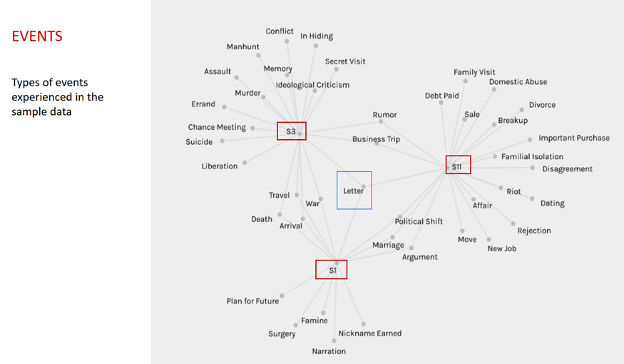
This graph visualizes both event types and patterns in the overlap of events among the stories. For instance, a letter-focused event by default involves movements through time and space, and it occurs in all three stories, reflecting the importance of this mode of communication.
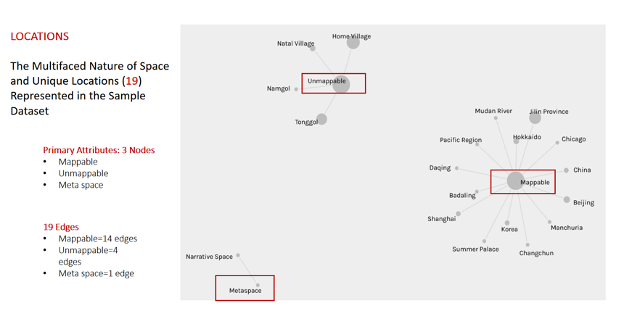
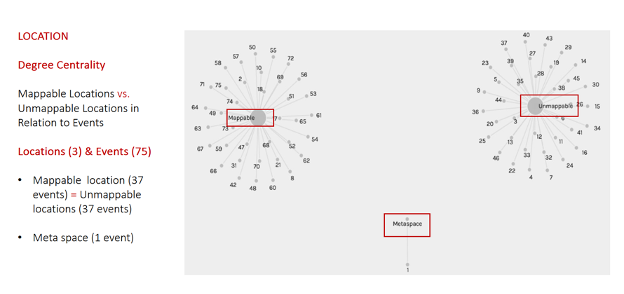
As events must occur in space, we visualized the relationship between locations and the nature of those locations. In Figure 3, fourteen of the nineteen edges are associated with mappable locations, indicating a high degree of intersection between the literary realm and identifiable geography.
Significantly, mappable and unmappable spaces host the same proportion of events as shown in Figure 4. This graph evidences the importance of unmappable space in these narratives, an aspect that would not have been readily apparent otherwise.
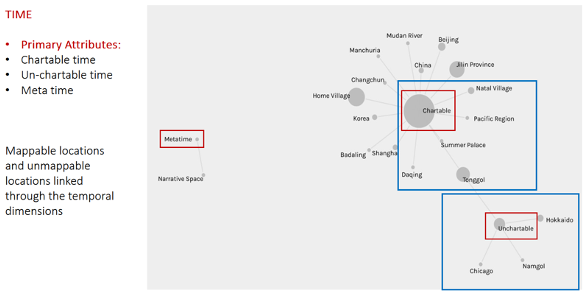
Our linking method enabled us to visualize mappable and unmappable locations (edges) via the nature of time (nodes) as shown in Figure 5.
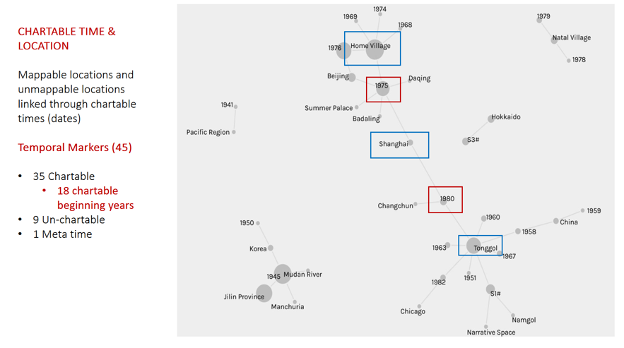
Similarly, the links between locations and chartable time can be delineated by a third element as in Figure 6. Shanghai (a mappable location), for example, is connected to Tonggol (an unmappable location) through their shared chartable time, 1980. Shanghai is also linked to Home Village, another unmappable location, through the year 1975.
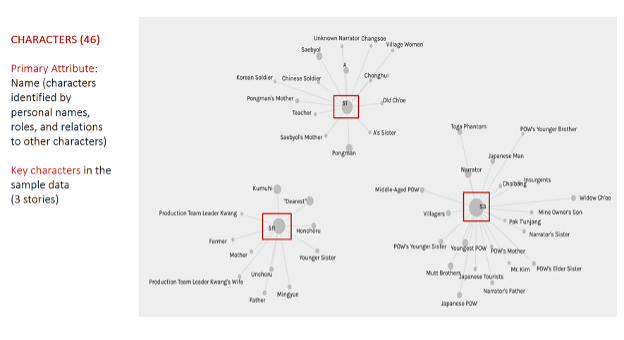
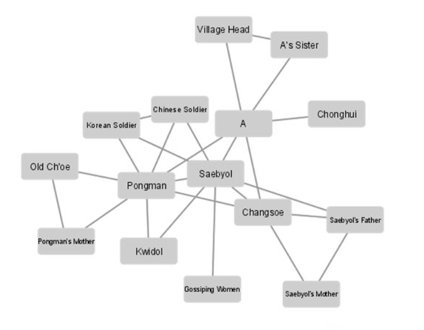
Moreover, characters’ relationships with time and space can be visualized. Figure 7-a demonstrates the characters in their respective textual spaces. The size of the circle associated with each character reflects the number of their appearances in the story. For example, in Story 1 (S1), the largest circles are associated with Pongman and Saebyol, reflecting their role as the two main characters, whereas in Story 3 (S3) the largest circle belongs to the first-person narrator-cum-protagonist. The relationships among characters within a story can also be visualized as shown in Figure 7-b in which Pongman and Saebyol again function as two nodes in the character web, demonstrating their centrality within the story.
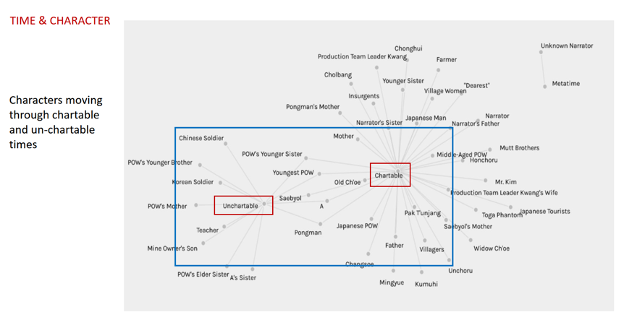
The relationship between characters and time is also important in visualizing how the characters move through chartable and unchartable time as shown in Figure 8.
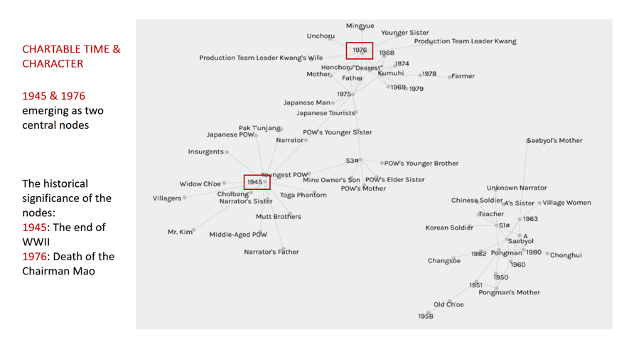
Moreover, the visualized relationship between characters and chartable times brings out the importance of particular years within the stories. Figure 9-a illustrates clusters of characters around the central nodes of 1945 and 1976. These are also historically important years: WWII ended in 1945 and Chairman Mao died in 1976.
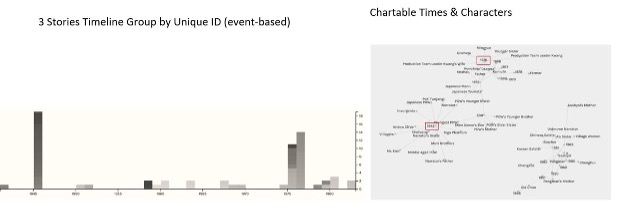
The significance of 1945 and 1976 also emerges from an aggregate event timeline, mirroring the same pattern seen in the chartable time and character graph (Figure 9-b).
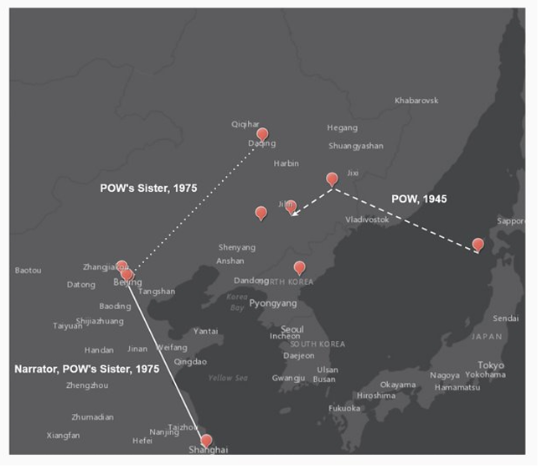
The movements through mappable space and chartable time can be also visualized with ArcGIS, a mapping platform, as shown in Figure 9-C. However, since this project’s main objective is to visualize the connections between the mappability and unmappability of space, the abstract nature of graphs generated by Palladio is better suited for visualizing this aspect of the project.
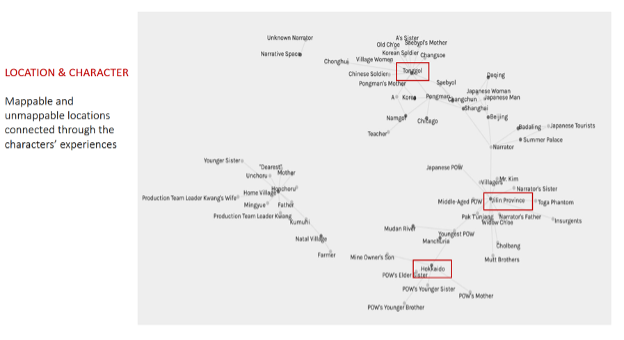
Furthermore, the relationship between characters and spaces can be visualized. Figure 10 highlights the links between mappable and unmappable locations through a third element, in this case characters and their experiences.
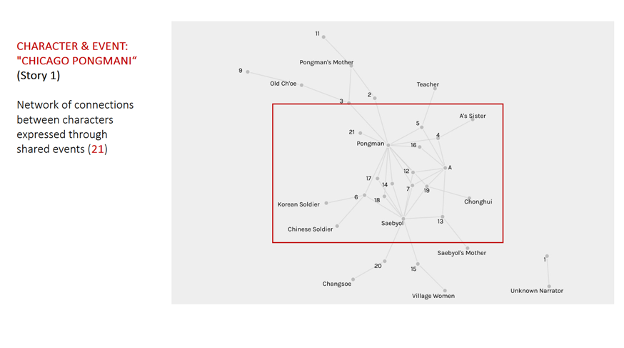
The last example of our visualized data (Fig. 11) illustrates a complex network between Story 1’s characters via their connection through shared events, reflecting again the degree to which the two main characters, Pongman and Saebyol, appear in this story’s events.
Final Word
As shown in this report, the DH@MSU seed grant 2022 enabled us to launch our project in Summer 2022. Based on the outcomes of this pilot project, we will continue with our full-scale project. Upon completion, we plan to expand it to investigate and visualize additional movements through time and space as indicated in Table 4.
If you have any feedback on this report or the project, contact us. Thank you.
Catherine Ryu (ryuc[at]msu[dot]edu): Principal Investigator
Olivia Hale (strangol[at]msu[dot]edu): Co-Principal Investigator